Charlie Munger was Vice Chairman of Berkshire Hathaway, and Warren Buffett’s closest business partner and right-hand man. As a legendary and pragmatic investor and active philanthropist, Munger was a Harvard Law graduate and was known for his wide-ranging wisdom across a multitude of disciplines.
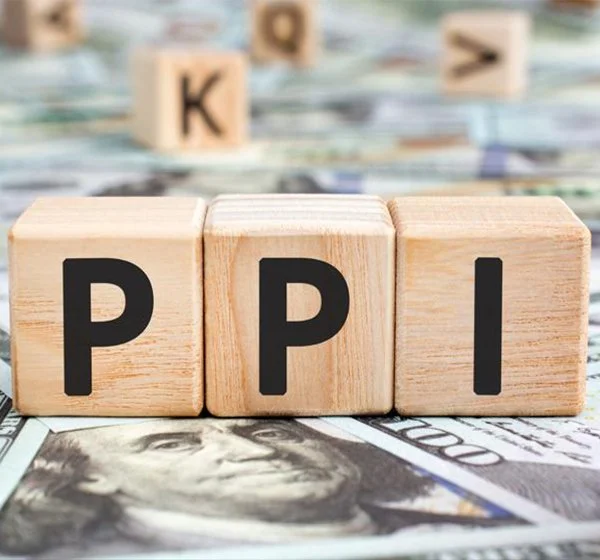
Read MoreThe Producer Price Index measures the average changes in prices that producers receive for their goods and services over a specific period. This essential economic indicator gives you an unparalleled view of inflationary trends at the industry level. By monitoring price changes from the producer's perspective, you can gain a unique understanding of the underlying forces that shape our economy.
Read MoreThe SQQQ is an inverse, leveraged exchange-traded fund (ETF) that tracks the inverse performance of the NASDAQ-100 Index. It provides traders and investors with an excellent opportunity to capitalize on declining stock prices, making it a powerful tool for hedging and maximizing potential returns during bearish periods.
Read MoreThe Consumer Price Index (CPI) is a cornerstone of economic indicators that gives insight into the state of a nation's economy. Released monthly by governmental agencies, the CPI measures the average change in prices of a basket of goods and services commonly purchased by households over time.
Read MoreTQQQ is a 3x levered fund that seeks to magnify the daily movement of the QQQ (a ETF that mirrors the Nasdaq 100).
Read MoreAn inverted yield curve illustrates that long-term interest rates are less than short-term interest rates. With an inverted yield curve, the yield decreases the farther away from the maturity date. Sometimes referred to as a negative yield curve, the inverted curve has proven in the past to be a reliable indicator of a recession.
Read MoreStock market monthly patterns are the directional tendencies of the stock indices based on the time of the year. Certain times of the year tend to be more bullish for stocks, while other times during the year are more bearish. Monthly patterns are similar to trading chart patterns. Chart patterns are trends that form within the price action and can be used to find favorable investing opportunities.
Read MoreWe are often asked to discuss all of the significant declines in the stock market over the years from the Great Depression in 1930 to the Great Inflation of 2022. So, we have collected all of the data on the 12 most significant declines in stock market value in the last 100+ years.
Read MoreA turnover rate in investing is the percentage of a mutual fund or other portfolio holdings that have been replaced in the course of one year.
Read MoreStop loss hunting is a strategy that attempts to force some market participants out of their positions by driving the price of an asset to a level where many individuals have chosen to set stop-loss orders.
Read MoreWe want to begin by saying thank you to all of our TradePro members. We truly appreciate you being a part of our investing family. While 2022 was great for TradePro and our members, it was disastrous for the overall markets. The S&P 500 had its worst year since 2008 (-19.64%) and TradePro had its second best year on record (+83.12%).
Read MoreDiversification is a risk management strategy that mixes a wide variety of investments within a portfolio in an attempt at limiting exposure to any single asset or risk.
Read MoreThe Roth IRA is one of the best investment account options for middle-class families to build wealth. Following are 6 things to know about Roth IRA’s and 6 reasons you should consider starting to invest in a Roth IRA.
Read MoreA registered investment advisor (RIA) is a firm that advises clients on securities investments and may manage their investment portfolios. RIAs are registered with either the U.S. Securities and Exchange Commission (SEC) or state securities administrators.
Read MoreA stock index is a method to organize and track the performance of a group of assets in a standardized way. Indexes typically measure the performance of a basket of securities intended to replicate a certain area of the market. The performance of a market index provides a quick way to see the health of certain areas of the market.
Read MoreA dividend is the distribution of a company's earnings to its shareholders and is determined by the company's Board of Directors. Dividends are typically distributed quarterly and paid out as cash or in the form of reinvestment in additional stock.
Read MoreA recession is a significant decline in economic activity that lasts for months or even years. Experts declare a recession when a nation’s economy experiences negative gross domestic product (GDP), rising levels of unemployment, falling retail sales, and contracting measures of income and manufacturing for an extended period of time.
Read MoreThe Rule of 72 is a quick, useful formula that is popularly used to estimate the number of years required to double the invested money at a given annual rate of return.
Read MoreValue investing is an investment strategy that involves selecting stocks that are trading for less than their intrinsic or book value. Value investors actively seek out stocks that the stock market is undervaluing. They believe the market sometimes overreacts, resulting in stock price movements that do not accurately reflect a company's long-term fundamentals. This overreaction offers an opportunity to buy stocks at discounted prices.
Read MoreBlackRock, the worlds largest investment corporation has created an operating system called Aladdin which stands for Asset, Liability, and Debt and Derivative Investment Network. It is an electronic system that handles about $21 trillion in assets and is a platform that helps in decision making, effective risk management and efficient trading.
Read More


